


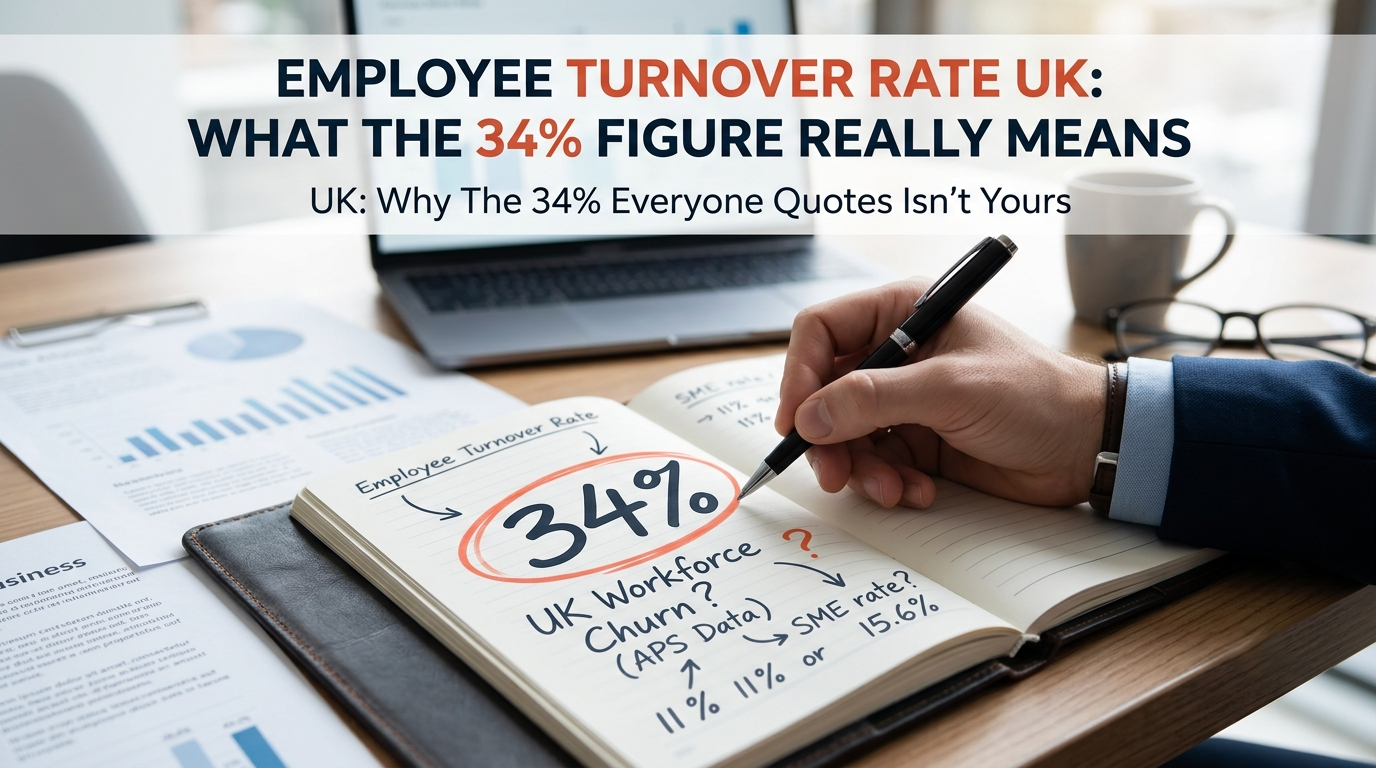
An HR director I was talking to last month opened her laptop and showed me her turnover number. 11%. “We’re half the UK average,” she said. “So we’re fine, right?”
Her average UK figure was 34%. The number she had in her spreadsheet was something quite different. She wasn’t fine & wasn’t in trouble either. She just didn’t yet know what her own number meant.
This confusion is everywhere. Google “employee turnover rate UK” and you’ll find pages quoting 34%, 35%, 15%, 16.8% and about a dozen industry splits that don’t agree with each other. Half of these numbers are describing the same workforce in different ways. The other half are quoting figures that are quietly five years old.
If you’re going to use a benchmark to make a decision about your people, you need to know which number you’re looking at, what it actually measures, and whether it has anything to do with you.
There are two numbers in common circulation, and they measure different things. The one most widely quoted is around 34%. The one that will actually resemble your HR system’s output is substantially lower.
The 34% figure comes from CIPD analysis of the Office for National Statistics Annual Population Survey, covering January 2022 to December 2023. It describes churn across the entire UK workforce. According to the CIPD, that 34% breaks down into 27.4% of people who moved to a new employer within the year, plus 6.6% who left the workforce entirely for reasons like study, retirement, long-term sickness, or a career break.
That is a labour-market statistic. It tells you how dynamic the UK workforce is. It does not tell you what your HR system should be reporting.
Employer-reported turnover, which is what most HR teams actually calculate, sits well below that. The gap exists because an employer-reported rate only counts people who left your organisation. The APS churn figure counts movement across the whole labour market, including people who left one job and started another the same month.
When a vendor blog or a jobs-site stats page tells you “the average UK turnover rate is 34%”, they are almost always quoting the APS figure as though it were an employer benchmark. It isn’t.
The simplest, most widely used formula is: leavers in the period, divided by average headcount during the period, multiplied by 100.
For a 12-month calculation:
A worked example. You run a 120-person SME. On 1 January you had 115 employees. On 31 December you had 128. During the year, 19 people left.
Average headcount: (115 + 128) / 2 = 121.5
Turnover rate: (19 / 121.5) × 100 = 15.6%
Three things trip people up here.
First, mid-year joiners inflate the denominator if you use a simple average and your headcount grew sharply. If you’ve scaled from 60 to 120 in 12 months, a monthly average of headcount gives you a more honest denominator than a start-and-end average.
Second, people confuse turnover with attrition. Turnover is everyone who left. Attrition is specifically the leavers you didn’t replace, because the role was closed. If a leaver is backfilled, that’s turnover but not attrition. If a role is deleted after the leaver walks, that’s both.
Third, voluntary and involuntary leavers get bundled together, and they shouldn’t be. Someone who resigned to join a competitor is a very different signal from someone you let go for performance. Many SMEs report a single blended rate and lose the ability to interpret it. Split them from day one, even if the sample size is small.
The answer depends almost entirely on your industry. Comparing a raw percentage to a single UK-wide average is the wrong exercise.
CIPD’s industry breakdown from the Annual Population Survey, covering 2022 to 2023, puts churn rates across sectors in a wide band. The two anchor points, both drawn directly from the CIPD benchmarking page, are:
| Sector | APS churn rate | Source (fieldwork period) |
| UK average (all workers) | 34% | CIPD, ONS Annual Population Survey (Jan 2022 – Dec 2023) |
| Hospitality (accommodation & food services) | ~52% | CIPD, ONS Annual Population Survey (Jan 2022 – Dec 2023) |
| Public administration & defence | ~25% | CIPD, ONS Annual Population Survey (Jan 2022 – Dec 2023) |
A note on these figures. They are APS-derived, so they describe labour-market churn in each sector, not what a given employer’s HR system will report. Employer-reported figures sit substantially lower. Detailed, employer-reported industry turnover is not published annually in the UK, so pages quoting precise 2026 sector figures are almost always recycling 2022 to 2023 data. Treat these as directional, not exact.
The useful move is to halve or two-thirds these APS figures for a rough employer-side comparator, and then layer on three more questions:
Hospitality and retail will always run higher than financial services. That isn’t a failure. It’s structural. A 25% turnover rate is excellent for a bar group and a crisis for an accountancy practice. The benchmark that matters isn’t national, it’s “similar businesses, same size, same roles, same labour market”.
For the current state of your own hiring cycle, the companion piece is on staff churn and how to break the hiring cycle.
The headline conditions are: hiring is cautious, retention is harder than last year, and employers are spending more to replace people who leave.
The latest CIPD Resourcing and Talent Planning Report, published 22 September 2026 with fieldwork between 2 April and 2 May 2026 across 1,014 UK employers, found 44% saying talent had become harder to retain. 52% said competition for well-qualified talent had increased over the past year. 48% increased their efforts to develop talent in-house.
The ONS September 2026 labour market release put UK vacancies at 702,000 for June to August 2026, down 8,000 on the prior quarter and below pre-pandemic levels. Unemployment edged up to 4.9% in the May to July period.
That combination matters. In a cooling market, employer-reported turnover often falls, because people are slower to quit when fewer roles are advertised. If your rate drops this year, don’t celebrate automatically. Check whether it’s dropped because people are happier, or because they’re stuck.
A good hire costs 1.5 to 3 times annual salary to replace, depending on seniority and specialism. Even at the lower end, every point of avoidable turnover is a six-figure line item for a mid-size SME. The pound value of fixing retention is almost always higher than the pound value of hiring faster.
Measure it properly, split it by segment, and move from counting leavers to predicting them.
Four actions, in order:
Benchmarks are useful for sense-checking. They are not a diagnosis. The UK’s 34% figure is a labour-market statistic, not a target. Your own number, split properly and tracked honestly, will tell you more in one quarter than any national benchmark will in a decade.
Around 34% at the whole-workforce level, according to CIPD analysis of the ONS Annual Population Survey for January 2022 to December 2023. That figure describes churn across the entire UK labour market, not what a typical employer’s HR system reports, which tends to be substantially lower.
Divide the number of people who left during the period by the average headcount during the same period, then multiply by 100. For 12-month calculations, use the average of your start-of-year and end-of-year headcount, or a monthly average if your headcount changed sharply.
There is no single good number. Rates vary from around 25% in public administration to around 52% in hospitality. A 15% rate is strong for most office-based sectors and would be exceptional in retail or hospitality. Compare against your own prior-year rate and similar businesses, not a national average.
Because they measure different things. Household survey data counts anyone who changed employer or left the workforce. Employer surveys count only leavers from the surveyed organisation. The two numbers can differ by 15 to 20 percentage points for the same labour market.
| About Sabiha Sabiha is Director of Talent Acquisition at Get Sponsored Job, with 16+ years of international hiring experience across the UK, Dubai, South Africa and Malaysia. She was shortlisted for Best Career Coach UK by the Career Development Institute. Her book How to Use AI to Win Talent and Retain People is published by Trotman in Autumn 2026 and is CIPD-aligned. She advises UK SMEs on AI-enabled hiring and retention systems. |

Global Talent. Ethical AI. Strategic Hiring. Sustainable Retention.